Moving Averages
30-Week Moving Average
Also called: 30-week, 30 week, 30-week MA, 30-week moving average, 30-week average
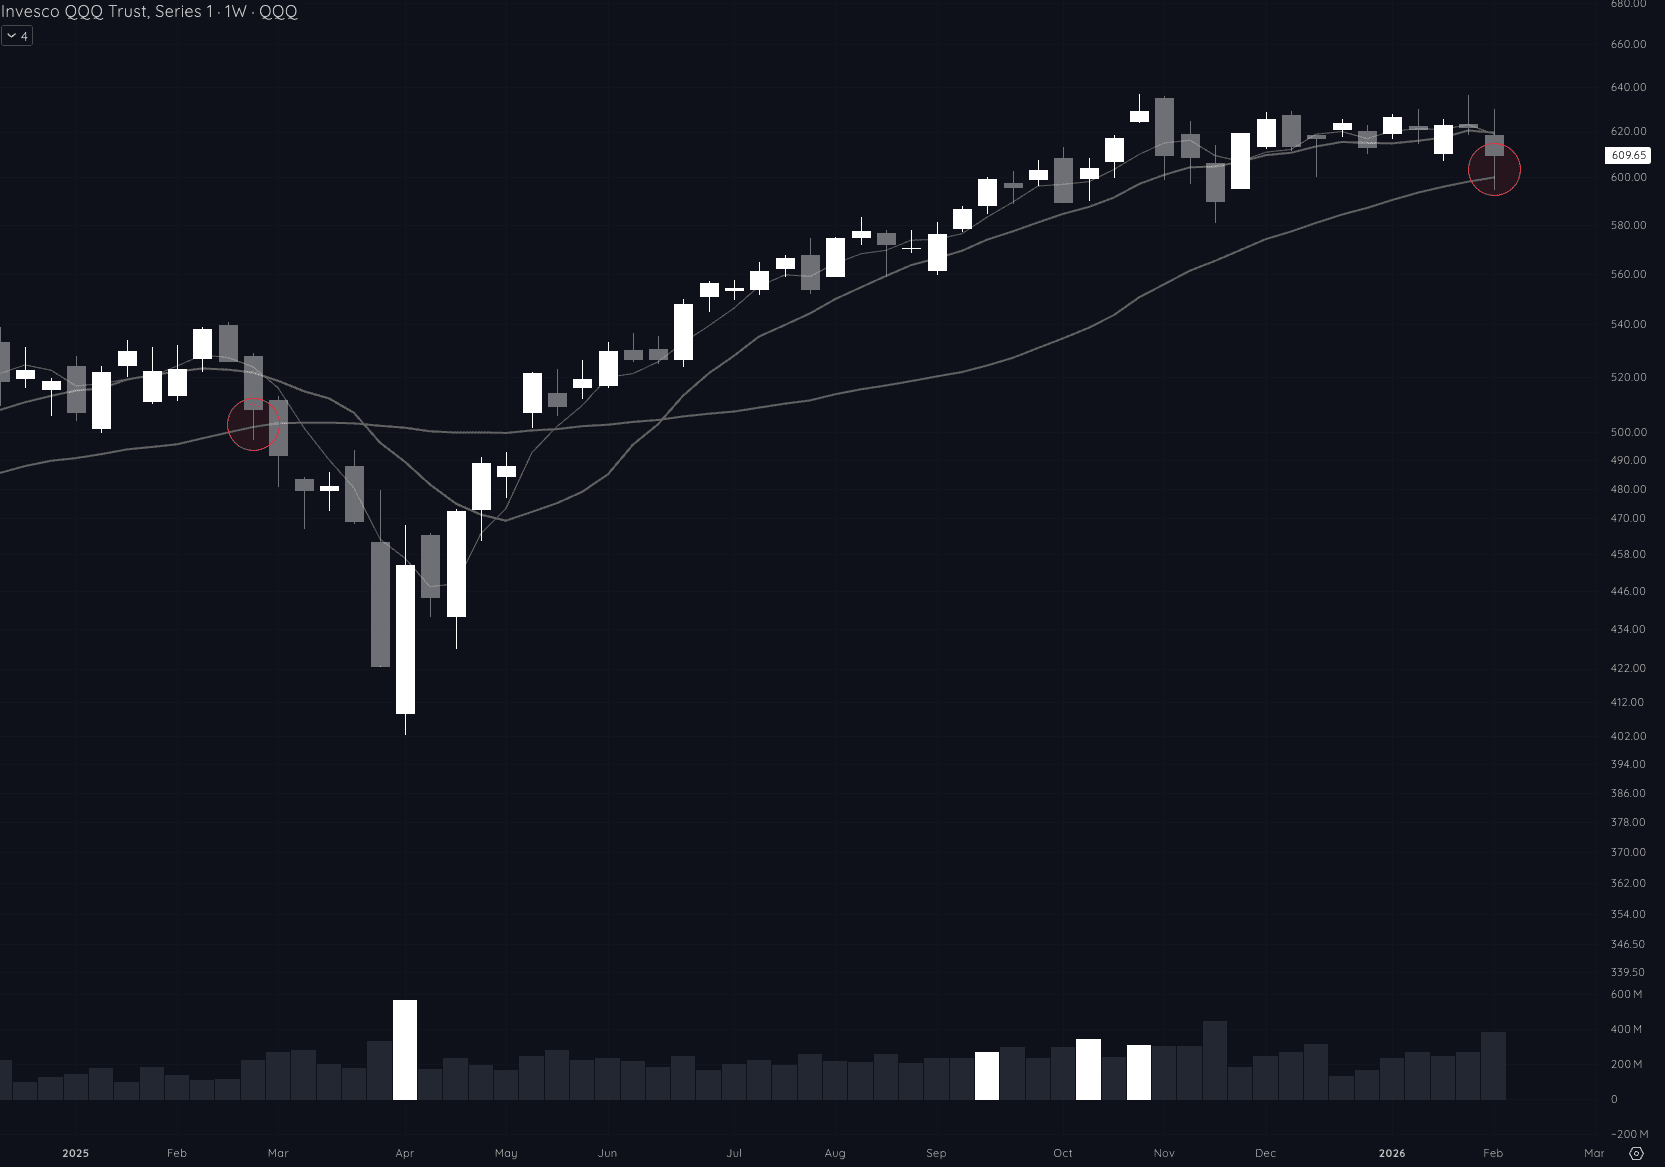
The average closing price over the last 30 weeks on the weekly chart. This is the major trend line, if a stock is above the 30-week the long-term trend is up and if it's below the trend is down. When leading stocks break below the 30-week it's a significant warning about the overall market environment.
On the Chart

In Context
“This week QQQ closed below the 30-week for the first time and suddenly there's nothing to argue about anymore.”
The Easy Part·Digest
“NVDA 10 and 30-week MAs converging tight, marked last week's high.”
The Easy Part·Digest
“Once QQQ closed below the 30-week and the follow-through day concept gave me something specific to wait for, the anxiety went away.”
The Easy Part·Digest
“Big gap down below the 30-week on QQQ and buyers showed up aggressively, 73%+ of stocks moving higher by the close.”
Death by a Thousand Cuts·Digest
“ENPH early strength with a new potential higher low at the rising 30-week, still a top focus but about 7% to low which is too wide for meaningful size”
Death by a Thousand Cuts·Digest