Chart Patterns
Higher Lows
Also called: higher low, higher-low
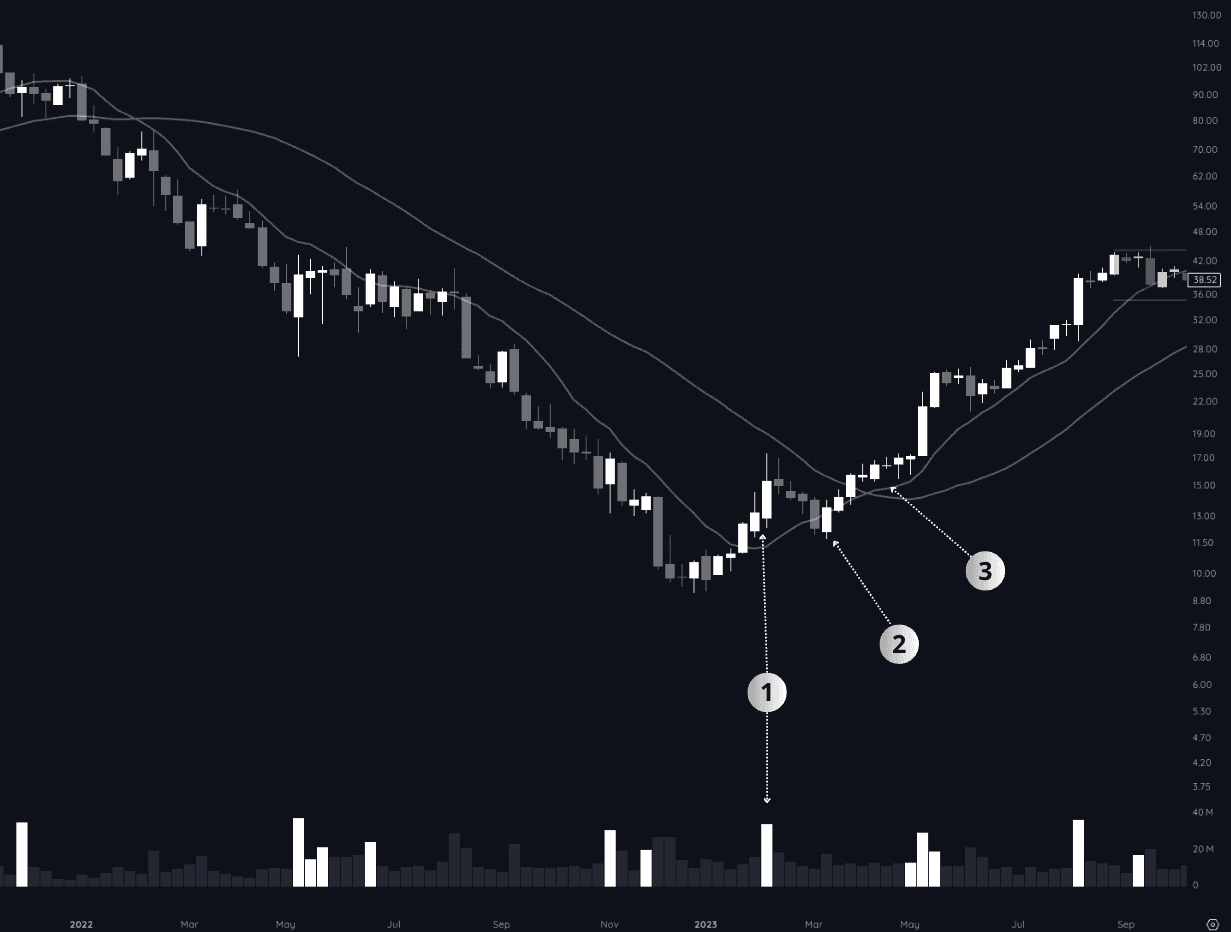
When a stock pulls back and holds above the prior low on the weekly chart, showing that buyers are getting more aggressive and sellers are losing control. Each higher low is a piece of evidence that the trend has changed because in a downtrend every bounce gets sold into and makes a lower low, so when that pattern breaks it means something.
On the Chart
In Context
“ENPH early strength with a new potential higher low at the rising 30-week, still a top focus but about 7% to low which is too wide for meaningful size”
Death by a Thousand Cuts·Digest
“The focus now is just waiting for a potential new higher low to be established and for the solar group to stop breaking down.”
Nothing's Changed Yet·Digest
“I entered on the gap but it got extended quickly and I got stopped out, which was the correct call, except the thesis hadn't changed because character changes almost always produce a higher low after the initial move rather than just rolling back over, so that was what I was watching for.”
“Bought HOOD on Tuesday when it pulled back into the green zone, watching for last week to hold as a higher low.”
“Position remains valid as long as the higher low stays intact.”